Making Tomograms
You can make your own tomogram puzzles. Start with a blank template. Here are several tomogram templates. Tomograms are typically square or rectangular, but they may have other shapes.
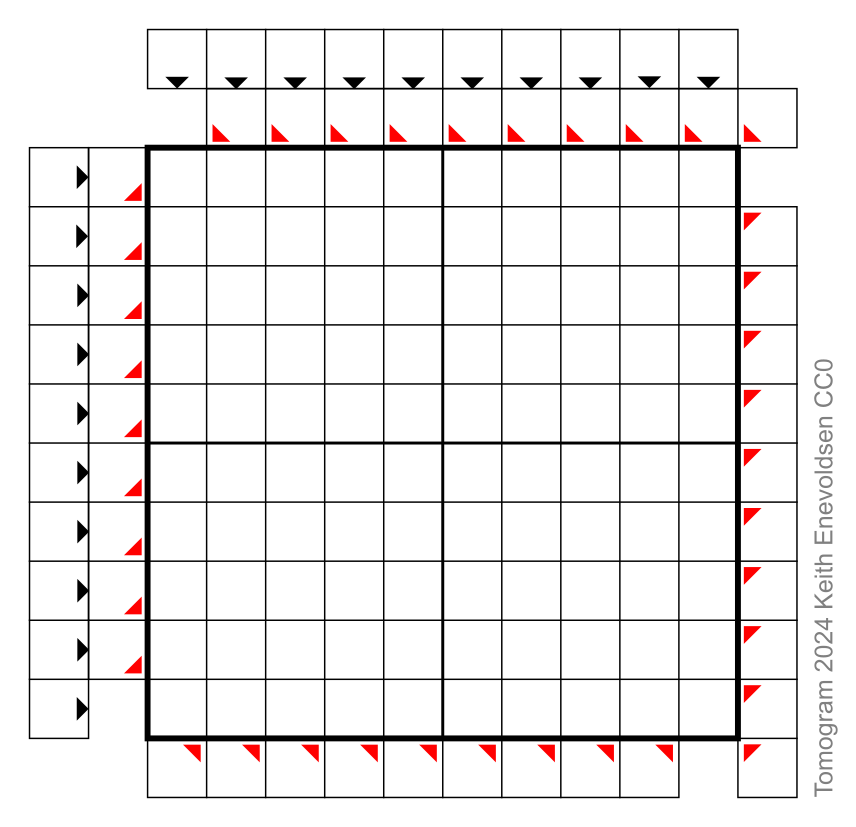
Print a blank template and fill in cells to make a picture. Count the filled cells in each row, column, and diagonal and write the numbers into the clue cells. Copy the clue numbers to another blank template and test solve it yourself. If it is solvable, copy the clue numbers to another blank template and give it to a friend to solve.
You must test solve your puzzle to make sure that it is not too difficult.
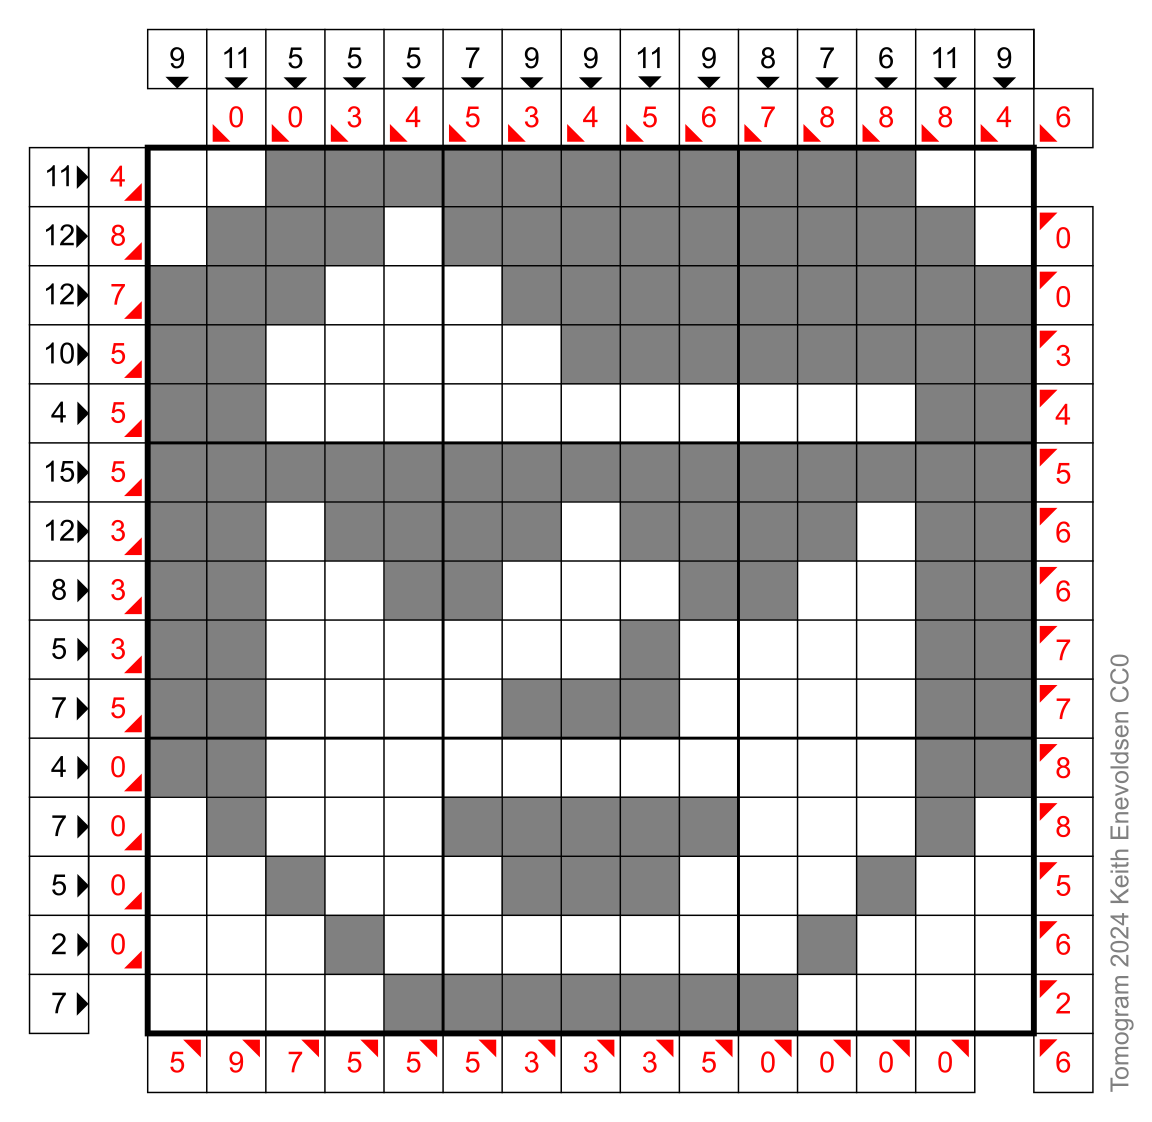
You should design for solvability. For small puzzles (~10x10), most pictures that you draw will be easy to solve. But for larger puzzles (≥15x15), most pictures that you draw will be extremely difficult to solve unless you design for solvability. Pictures that contain longish horizontal, vertical, and diagonal lines are more solvable. Start by making a few rows, columns, or longish diagonals be all filled or all empty.
It is possible for a tomogram to be ambiguous, with more than one solution.

Tomograms may have more numbers than are needed to solve the puzzle. You may omit some numbers to make it more challenging.
Designing Tomograms in a Spreadsheet
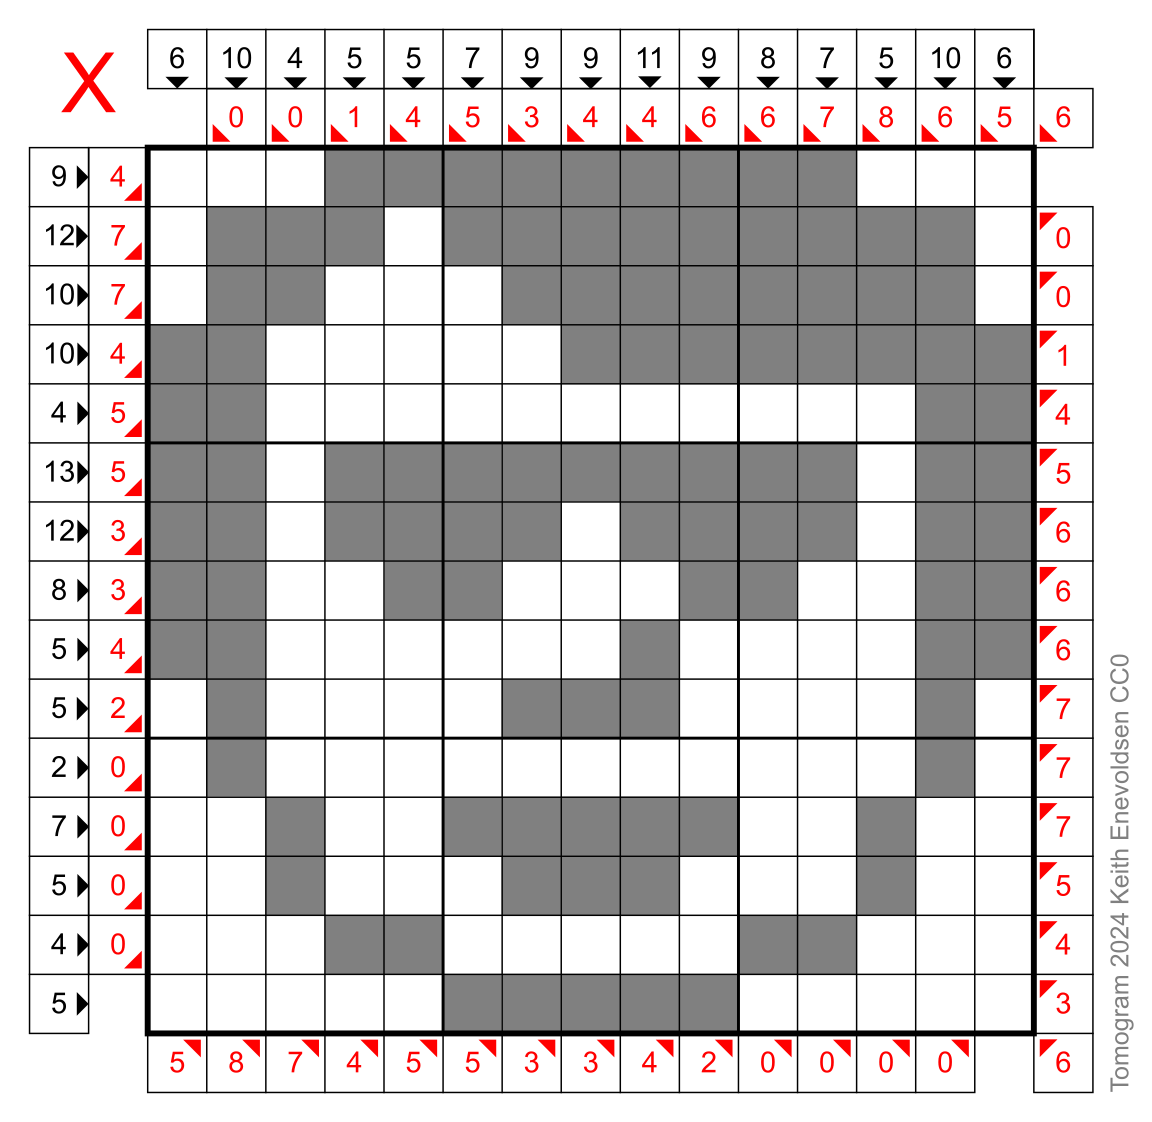
You can make a simple spreadsheet that helps you make tomograms by automatically calculating the clue numbers for the rows, columns, and diagonals.

Making a tomogram design spreadsheet. First, choose your grid size (such as 15x15). (For multiple sizes, make multiple sheets.) Lay out your spreadsheet as shown above. Make the cells be small squares. In the design grid, you will enter ones for filled cells and zeros for unfilled cells. Conditionally format the design grid cells to have fill colors based on their values (1 = dark, 0 = light). The clue number cells (light blue and pink) are positioned exactly as in the printable tomogram puzzles (but no direction arrows are shown in my spreadsheet). For each clue cell, enter a formula to count the number of filled cells (the sum of ones) in its slice (row, column, or diagonal). You can easily sum a row or column (for example, "=SUM(C3:C12)"). To sum a diagonal, you can add up all the cells (for example, "=C3+D4+E5+..."), or you can write a function to do it.
Tomogram Solver
When you design tomogram puzzles, it is useful to have an automated solver to quickly determine whether your puzzle designs are solvable or not. If you enjoy writing code, you can make a spreadsheet that solves tomograms. The coding is left as a fun exercise for the reader.

Making a tomogram solver spreadsheet. First, choose your grid size (such as 15x15). (For multiple sizes, make multiple sheets.) The layout of the solver spreadsheet is the same as the design spreadsheet. The clue numbers for the rows, columns, and diagonals are input. You can manually enter the clue numbers, or the solver spreadsheet can automatically pull the clue numbers from the designer spreadsheet. The picture grid is initially blank (not zeros). Conditionally format the solver grid cells to have fill colors based on their values (1 = dark, 0 = light, blank = another color). The solver will use the basic strategy with multiple passes. Make a push-button to run the solver. Each time you push the button it will do one pass. On each pass, the solver cycles once through all the slices (rows, columns, and diagonals). For each slice, it gets the clue number and counts the currently filled cells (ones), unfilled cells (zeros), and unknown cells (blanks). By simple calculation, it decides whether all the unknown cells in that slice are now determined to be all filled or all unfilled. If the unknown cells are now determined, it sets their values (to ones or zeros). It keeps doing passes until the puzzle is solved. If the solver gets stuck, then the puzzle is not solvable by the basic strategy.
Simplified Computed Tomography
A medical computed tomography (CT) scanner computes a cross-section image based on X-ray data from many directions. If you enjoy writing code, you can make a spreadsheet that roughly solves tomogram puzzles by doing a simplified version of computed tomography. The coding is left as a fun exercise for the reader.

Making a tomogram CT spreadsheet. The layout of the CT spreadsheet is the same as the solver spreadsheet. Make a function to calculate a rough probability that a cell is filled by combining the four probabilities (filled cells divided by total cells) for that cell's four slices (row, column, and two diagonals). Make each cell call the function to display its combined probability. Conditionally format the cells to have grayscale fill colors based on their values. A ghostly grayscale image will appear. Then tinker with your calculations to make the image clearer. (How should you calculate the combined probability? Should you add or multiply the probabilities? Should you combine odds or probabilities?)